Federated Computation of ROC and PR Curves
TL;DR: Privacy-preserving ROC/PR curve approximation for federated learning.
Introduction
Federated Learning allows multiple clients to collaboratively train models without sharing raw data. However, evaluation is often limited to simple aggregate metrics such as accuracy or loss, which provide an incomplete picture of model performance.
We propose a method to approximate Receiver Operating Characteristic (ROC) and Precision-Recall (PR) curves in federated settings, without accessing raw client data. Our approach supports both Secure Aggregation and Differential Privacy, providing provable error guarantees and low communication cost.
Method Overview
Our method consists of five main steps:
- Local Histograms: Clients build histograms for positive/negative scores.
- Aggregation: The server securely aggregates the client histograms.
- Quantile Estimation: Quantiles are estimated from bin counts.
- ECDF Approximation: Interpolate between quantiles to reconstruct ECDFs.
- Curve Construction: Use ECDFs to compute ROC and PR curves.
Quantile Estimation via Histograms
To estimate quantiles, each client builds a hierarchical histogram (Figure 1) by recursively dividing the score range into equal-width bins and counting the examples in each bin. The server aggregates these histograms and computes global quantiles based on the combined bin counts and boundaries.

To ensure clients’ privacy, we consider two mechanisms:
- Secure Aggregation: Server learns only global histogram, not individual client’s histograms.
- Differential Privacy: Clients add independent noise to each bin before sending to server.
Secure aggregation protects individual client contributions during computation, while differential privacy limits what can be inferred from the global aggregated data.
Curve Approximation via Quantiles
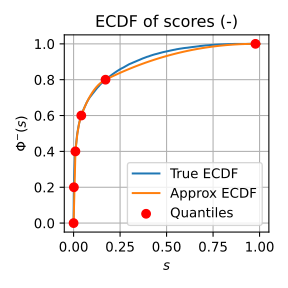
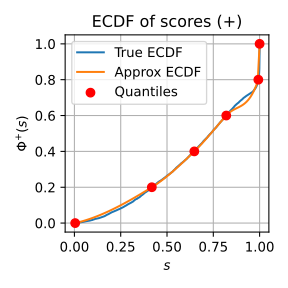
Let \Phi^-(s) and \Phi^+(s) be the ECDFs of prediction score distributions for negative and positive examples. We estimate Q evenly spaced quantiles (Q=6 in Figure 2), and apply monotone piecewise cubic polynomial interpolation (PCHIP) to approximate the full ECDFs.
For the ROC curve, we then compute:
T(s)=1-\Phi^+(s), \tag{1}
F(s)=1-\Phi^-(s), \tag{2}
where T(s) and F(s) denote the true positive rate (TPR) and false positive rate (FPR).
For the PR curve, recall is equivalent to TPR, and precision is computed as:
P(s)=\frac{T(s)n^+}{T(s)n^+ + F(s)n^-} \tag{3}
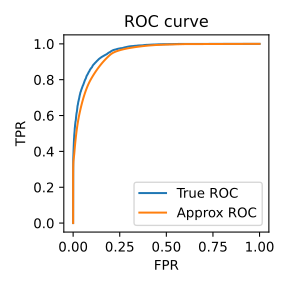
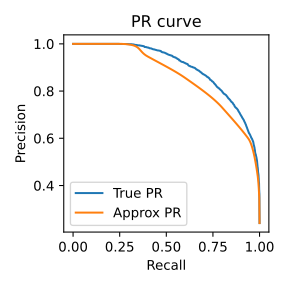
Here, n^+ and n^- are the number of positive and negative examples. Figure 3 shows the resulting approximate ROC and PR curves.
Theoretical Guarantees
To quantify approximation quality, we define the Area Error (AE) as:
Definition 1 AE is the integral of the absolute difference between the true and estimated curves: \text{AE}_\text{ROC} = \int_0^1 |T(f) - \hat{T}(f)| df, \tag{4}
\text{AE}_\text{PR} = \int_0^1 |P(t) - \hat{P}(t)| dt, \tag{5}
where T(f) = T(F^{-1}(f)) and P(t) = \frac{tn^+}{tn^+ + F(T^{-1}(t))n^-} are the true ROC and PR curves, and \hat{T}(f) and \hat{P}(t) are their estimates. Figure 4 illustrates the area error for the ROC curve.

Assuming Lipschitz continuity of score ECDFs \Phi^-(s) and \Phi^+(s), we bound the AE as follows:
Theorem 1 Let Q be the number of quantiles used. Then:
- Under Secure Aggregation: \text{AE}_\text{ROC}\le O(1/Q) and \text{AE}_\text{PR}\le\tilde{O}(1/Q).
- Under \varepsilon-Differential Privacy: \text{AE}\le\tilde{O}\left(\frac{1}{Q} + \frac{1}{n\varepsilon}\right), where n is the number of examples.
Empirical Evaluation
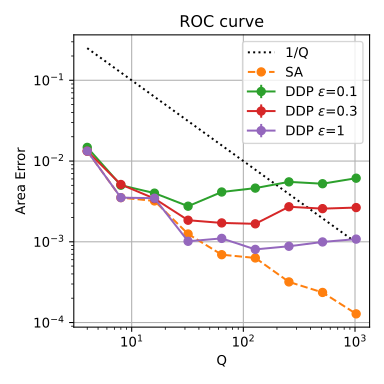
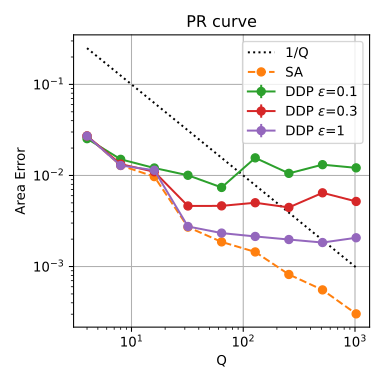
We evaluate our method on the Adult dataset using an XGBoost classifier, as shown in Figure 5. We vary the number of quantiles Q\in\{4,8,\dots,1024\} and test both Secure Aggregation (SA) and Distributed Differential Privacy (DDP) with privacy budgets \varepsilon\in\{0.1,0.3,1\}.
Key observations are as follows:
- Under SA, Area Error generally decreases as Q increases.
- Under DDP, the error initially decreases before reaching a plateau.
- PR curves generally have slightly higher Area Error than ROC curves.
- Smaller \varepsilon provides stronger privacy but introduces more error.
Citation
@article{Xu2026fedcurve,
  author = {Xu, Xuefeng and Cormode, Graham},
  publisher = {VLDB Endowment},
  title = {Federated {Computation} of {ROC} and {PR} {Curves}},
  journal = {Proc. VLDB Endow.},
  volume = {20},
  number = {2},
  date = {2026},
  url = {https://arxiv.org/abs/2510.04979},
  langid = {en}
}